Session Overview
| Section | Topic | Visual Aid |
|---|---|---|
| 0 | Welcome & Group Formation | — |
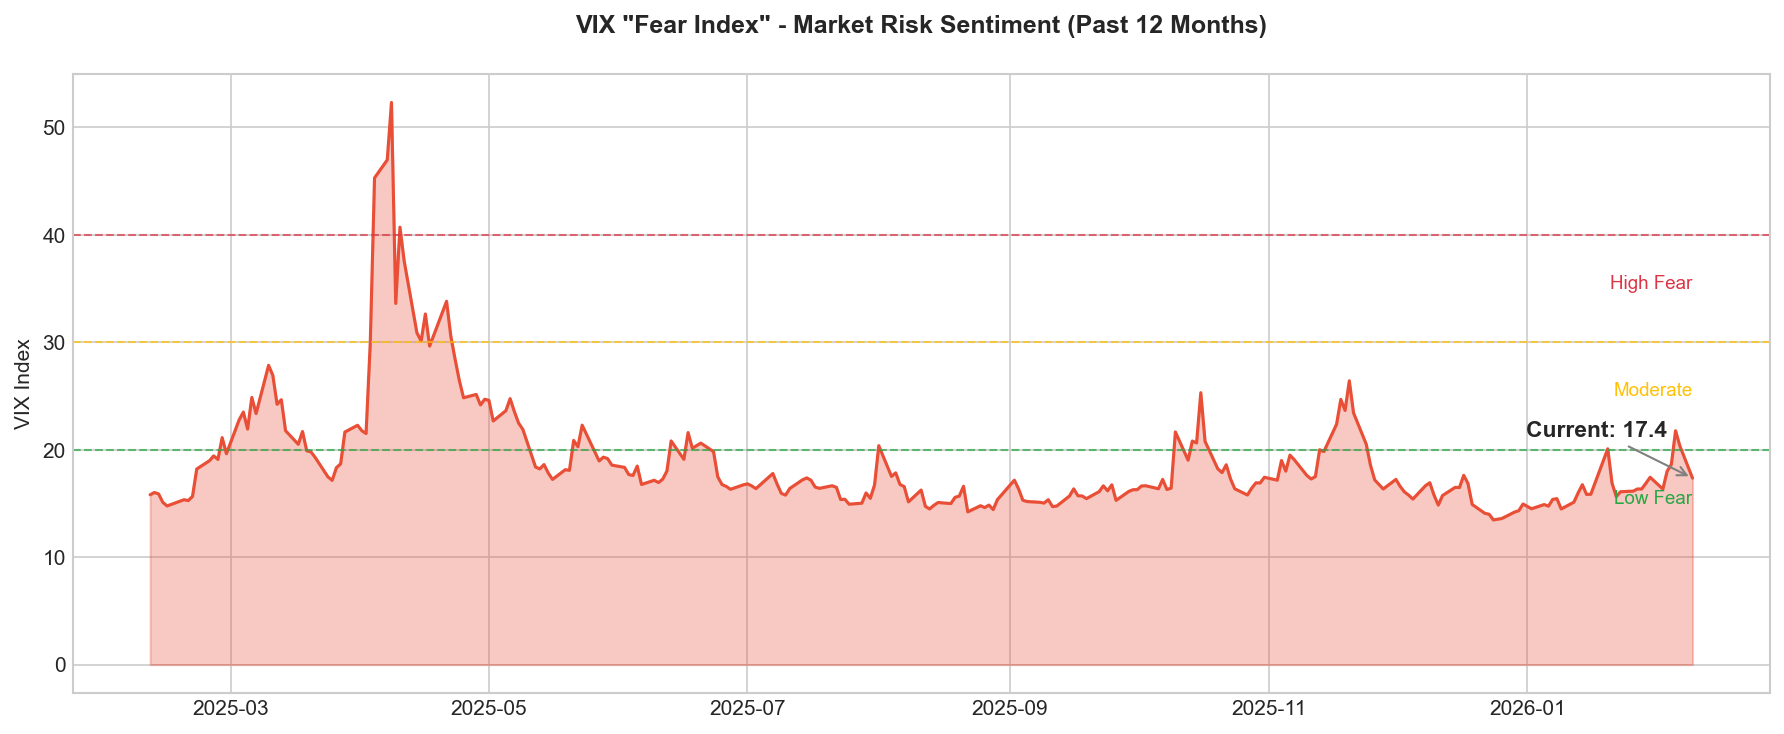
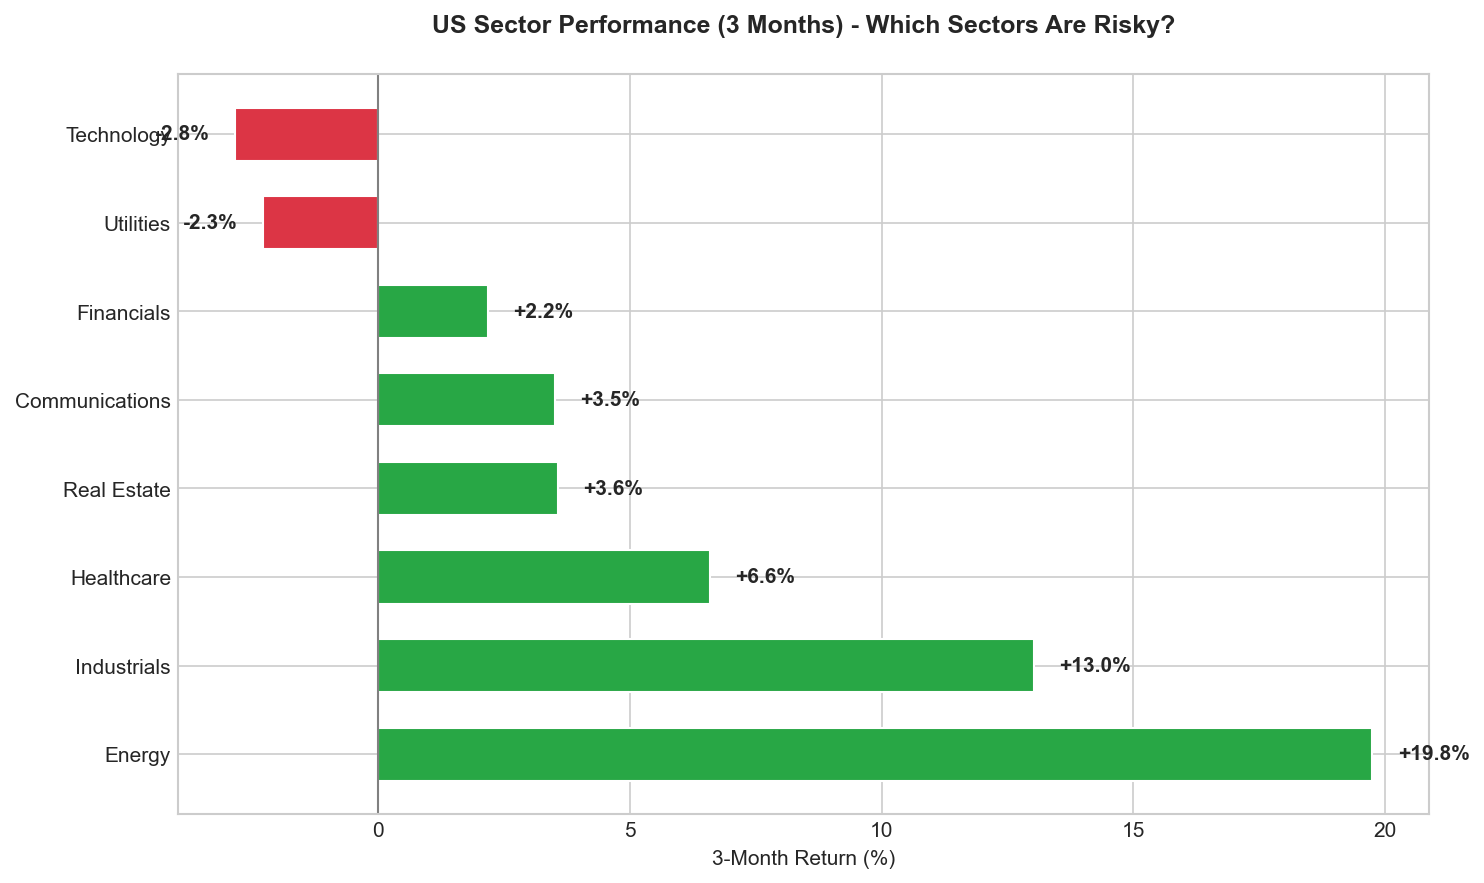
| 1 | What is Risk? (Current Events) | VIX chart, Sector performance |
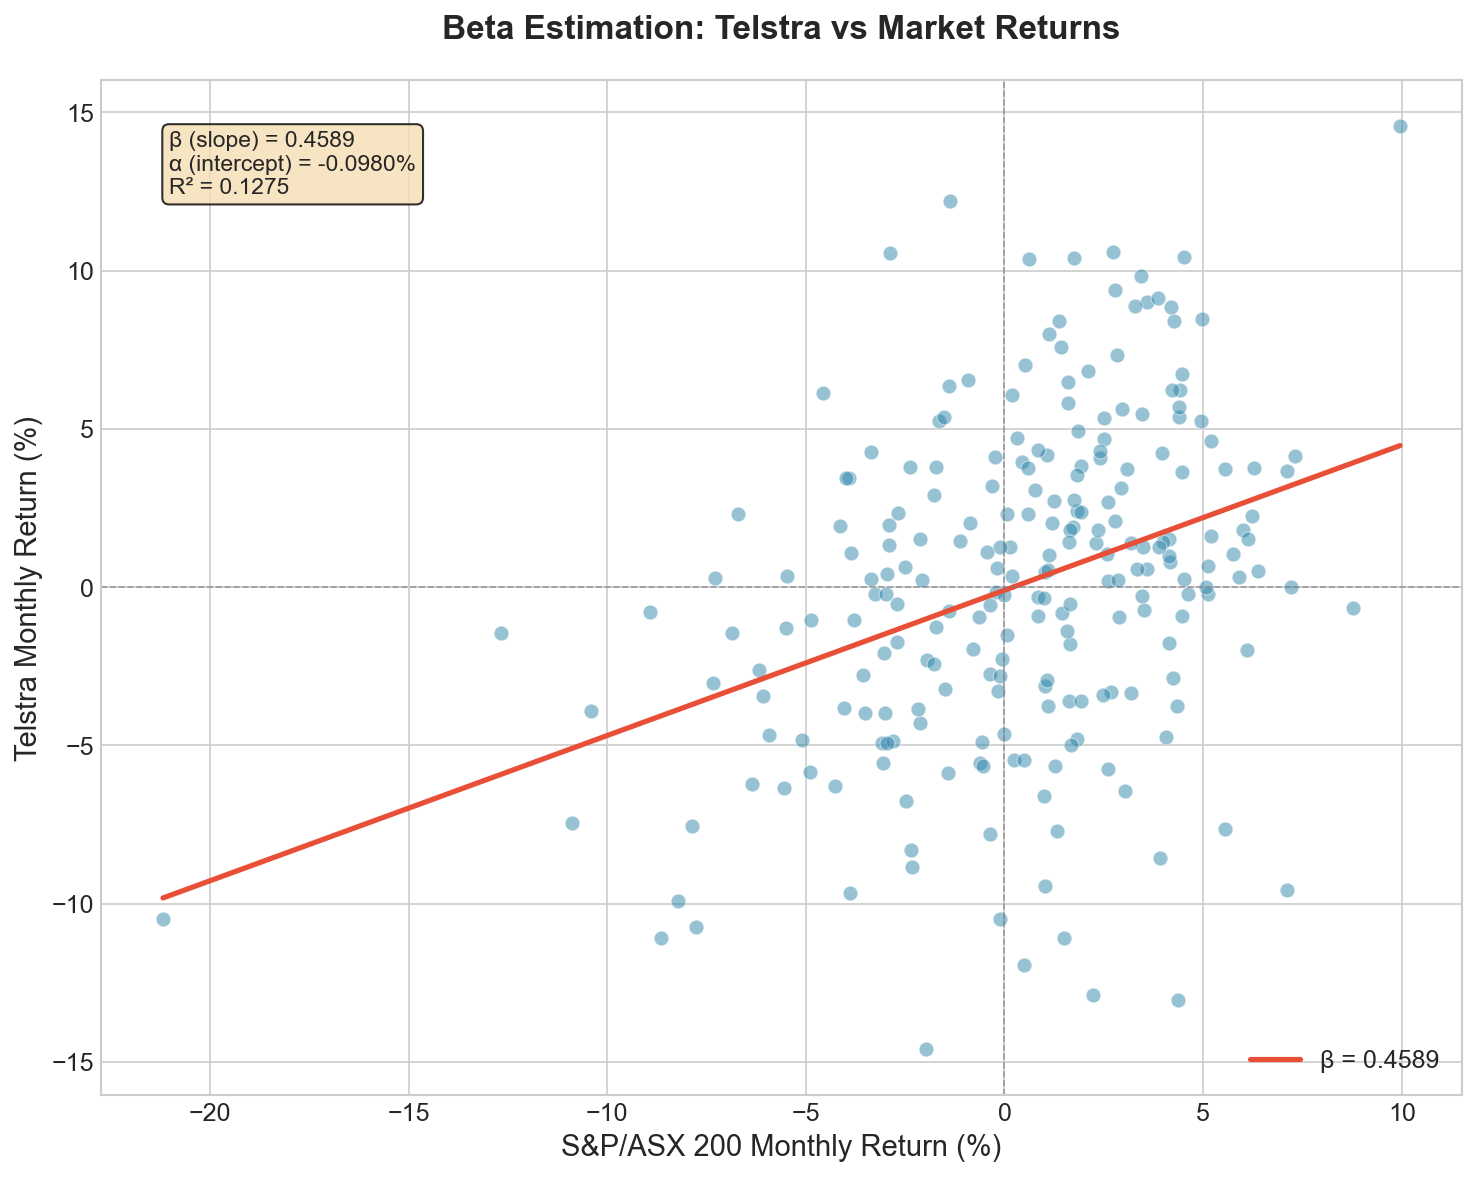
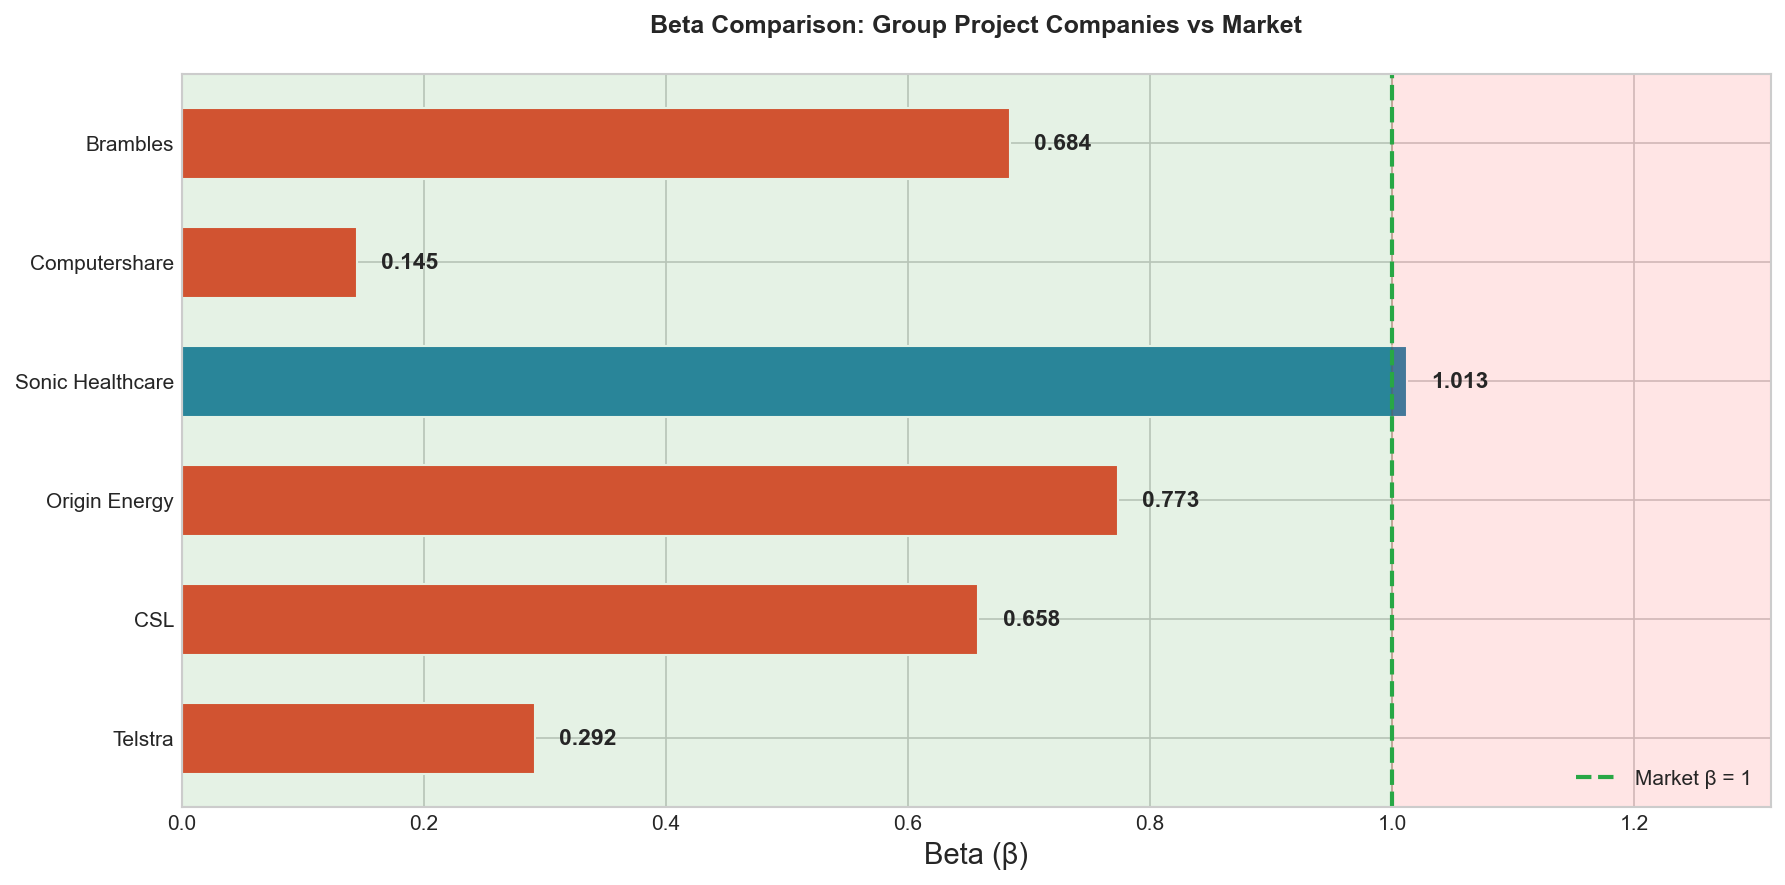
| 2 | Measuring Risk: Beta | Beta scatter, Beta comparison |
| 3 | The Price of Risk: Cost of Capital | Interest rates, SML |
| 4 | Your Company Deep Dive | Beta comparison, Capital structure |
Section 0: Welcome & Group Formation
Students form groups of 5 based on Student ID sum (mod 10):
| Sum | Company | Current Price | YTD Return | Beta |
|---|---|---|---|---|
| 0,1 | CSL | $183.64 | -30.7% | 0.658 |
| 2,3 | Origin Energy | $11.02 | +14.6% | 0.773 |
| 4,5 | Sonic Healthcare | $21.92 | -19.5% | 1.013 |
| 6,7 | Computershare | $32.20 | -7.1% | 0.145 |
| 8,9 | Brambles | $22.99 | +22.2% | 0.684 |
Section 1: What is Risk?
Group Discussion Questions
Each group discusses and prepares to present one of these:
CSL Group
Look at the VIX spike in early 2025. What type of risk does this represent — systematic or unsystematic? Could you diversify it away?
Origin Energy Group
The news mentions “U.S. military action in Venezuela, tariff threats.” How would you categorize geopolitical risk? How might it affect an energy company like yours?
Sonic Healthcare Group
Gold surged 30% then crashed in January 2026. Is this systematic risk or something else? What does this tell us about “safe haven” assets?
Computershare Group
The Fed held rates at 3.50–3.75% with two dissenters wanting cuts. Is interest rate uncertainty a systematic or unsystematic risk?
Brambles Group
Market sentiment is “cautiously optimistic” with Energy +14% and Tech negative. Which sectors are defensive vs aggressive right now? Why?
Synthesis
Why are traditionally “boring” sectors outperforming? What does this tell us about where we are in the economic cycle?
Section 2: Measuring Risk — Beta
Key Statistics
Beta (slope) = 0.459 | Alpha (intercept) = -0.098% | R² = 0.127
Group Discussion Questions
CSL Group
The R² is only 0.127 — meaning the market only explains 13% of Telstra’s movement. Is this good or bad? What explains the other 87%?
Origin Energy Group
Telstra’s beta is 0.46. If the market drops 10% tomorrow, what would you expect Telstra to do? Would you trust this prediction? Why or why not?
Sonic Healthcare Group
Look at the outliers — points far from the regression line. Pick one extreme point. What might have happened that month? Systematic or firm-specific event?
Computershare Group
We used monthly returns over ~20 years. What if we used daily returns over 1 year instead? How might the beta change? Which is “better”?
Brambles Group
The intercept (alpha) is -0.098%. What does a negative alpha imply about Telstra’s risk-adjusted performance?
Company Beta Comparison
| Company | Beta | Classification |
|---|---|---|
| Computershare | 0.145 | Very Defensive |
| Telstra | 0.292 | Defensive |
| CSL | 0.658 | Moderate |
| Brambles | 0.684 | Moderate |
| Origin Energy | 0.773 | Moderate-High |
| Sonic Healthcare | 1.013 | Market-like |
Surprising Betas?
Computershare has a beta of only 0.145 — almost like cash! Why might a financial services company be so defensive?
Sonic Healthcare is the only one with beta > 1. It’s a healthcare company — aren’t those supposed to be defensive?
CSL is down 30% YTD but has a “moderate” beta of 0.66. How can a stock lose 30% if it only moves 66% of the market?
Section 3: The Price of Risk — Cost of Capital
Capital Asset Pricing Model (CAPM)
E(rᵢ) = rᶠ + βᵢ × (E(rₘ) − rᶠ)
Group Discussion Questions
CSL Group
If the risk-free rate rises from 4% to 5%, and CSL’s beta is 0.66 with a 6% market risk premium, how much does CSL’s cost of equity change? Calculate it!
Origin Energy Group
News says “higher-for-longer rates elevate discount rates, compressing equity multiples.” In plain English, what does this mean for your company’s stock price?
Sonic Healthcare Group
You’re the only company with beta > 1. Does this make high interest rates better or worse for your valuation compared to peers?
Computershare Group
Your beta is 0.145. Calculate your cost of equity using CAPM with rᶠ=4.2%, MRP=6%. Is this realistic? What might be wrong?
Brambles Group
The news mentions “tech/financial stocks volatile while defensives outperformed.” Your company is in logistics. Are you a defensive?
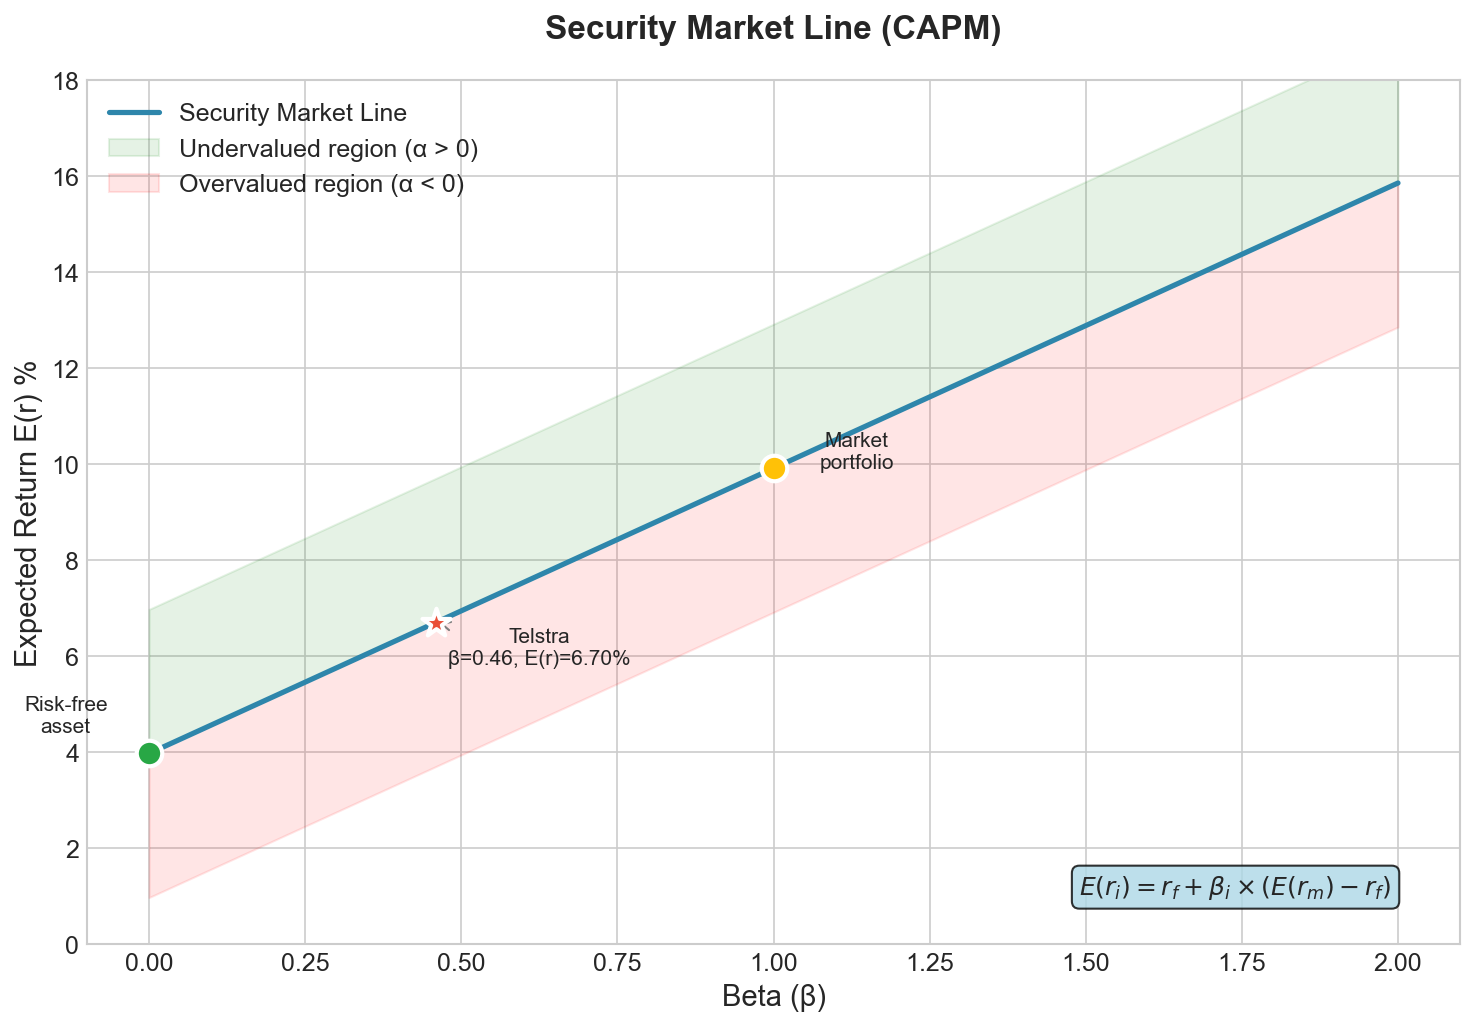
SML Discussion Points
Where does Telstra sit? (β=0.46, E(r)=6.7%)
Where would NVIDIA sit if its beta is ~1.8?
If a stock is ABOVE the line, is it over or undervalued?
The Fed pausing rates means rᶠ stays at ~4%. What happens to the entire SML if they cut?
Section 4: Your Company Deep Dive
Group Task (15 minutes)
1. Risk Profile: Based on beta and current news, what are the TOP 2 systematic risks facing your company right now?
2. Cost of Equity Estimate:
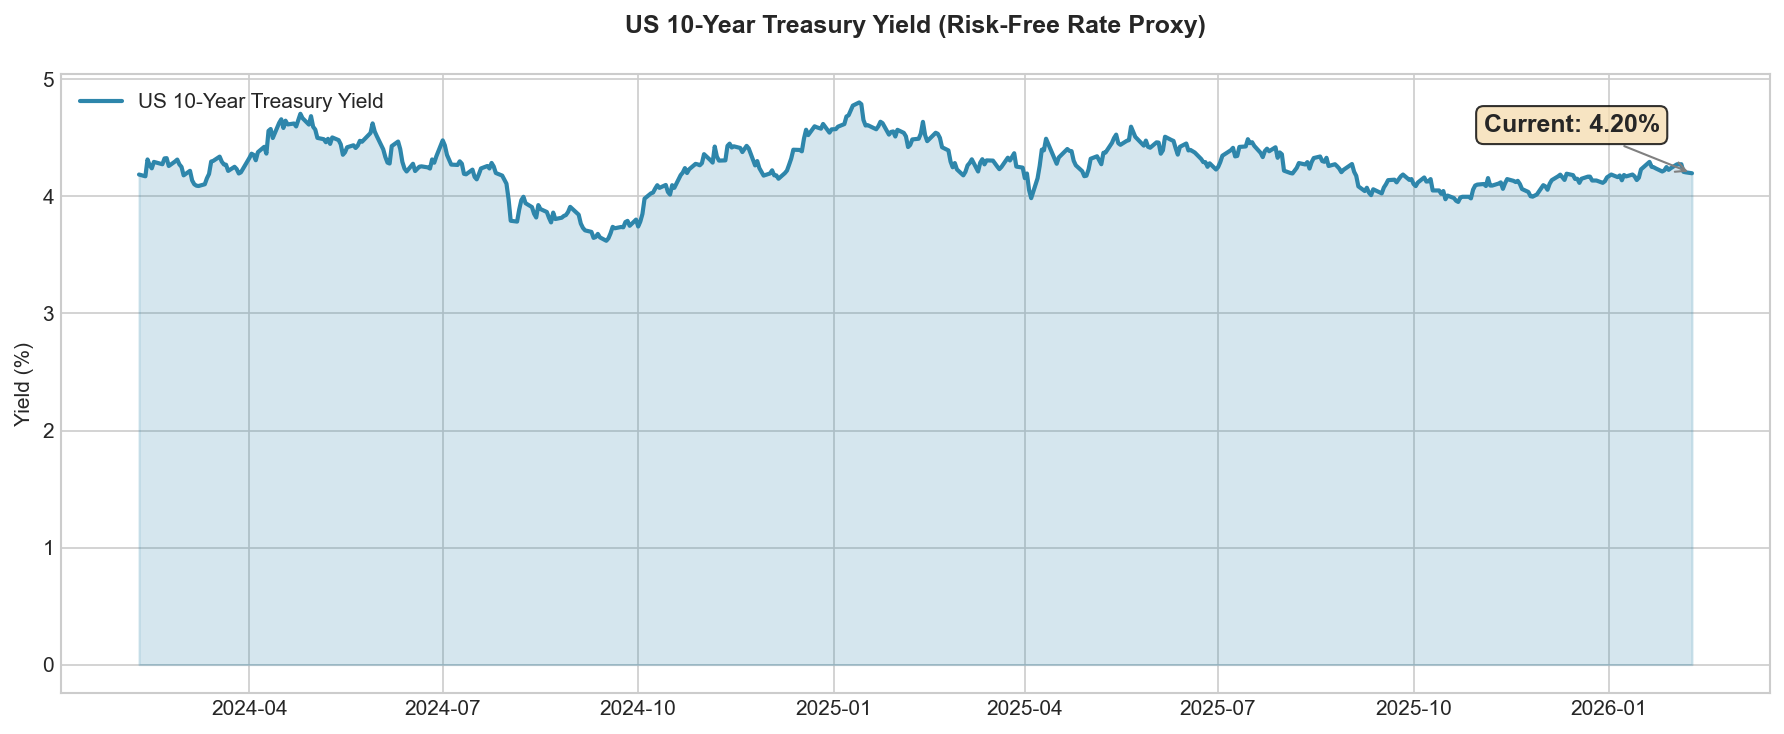
rᶠ = 4.2% (current AU 10-year proxy) | Your company’s beta (from chart) | MRP = 6%
Calculate: rₑ = rᶠ + β × MRP
3. Preliminary View: Your company’s YTD performance vs its beta — does the return match the risk level? What would you need to research to estimate cost of debt?
4. One Big Question: What is the single most important thing you need to understand about your company to value it correctly?
Submit: Top 2 Systematic Risks
What are the TOP 2 systematic risks facing your company right now? (Submit on behalf of your group)
Submit: One Big Question
What is the single most important thing you need to understand about your company to value it correctly?
Key Takeaways
- Systematic risk cannot be diversified — it determines required return
- Beta measures sensitivity to market, not total volatility
- Current macro environment (rates, geopolitics) affects ALL companies’ costs of capital
- Your company’s specific risks will determine if it trades above or below the SML
For Next Week
- Read Topic 2 (Financial Statement Analysis)
- Find your company’s latest annual report
- Calculate the Interest Coverage Ratio from the financials
- Bring one piece of company news that might affect valuation
Market Snapshot
| Metric | Value | Implication |
|---|---|---|
| VIX | 17.4 | Low fear, markets calm |
| US 10Y Yield | 4.20% | Risk-free rate elevated |
| Fed Rate | 3.50–3.75% | Holding, may cut mid-year |
| RBA Rate | 3.85% | Just hiked |
| ASX 200 YTD | +4.8% | Moderate positive |
| S&P 500 YTD | +14.8% | Strong performance |